
Let’s be honest for a second. Most of us start a SIP with a vague hope and a rough number in our heads. “I’ll invest five thousand a month, and in ten years, I’ll probably have a lot.” That’s not a plan. That’s optimism wearing a suit. And while optimism is lovely, it doesn’t quite cut it when you’re trying to figure out if you’ll actually have enough for your kid’s college, that home down payment, or, you know, an actual retirement.
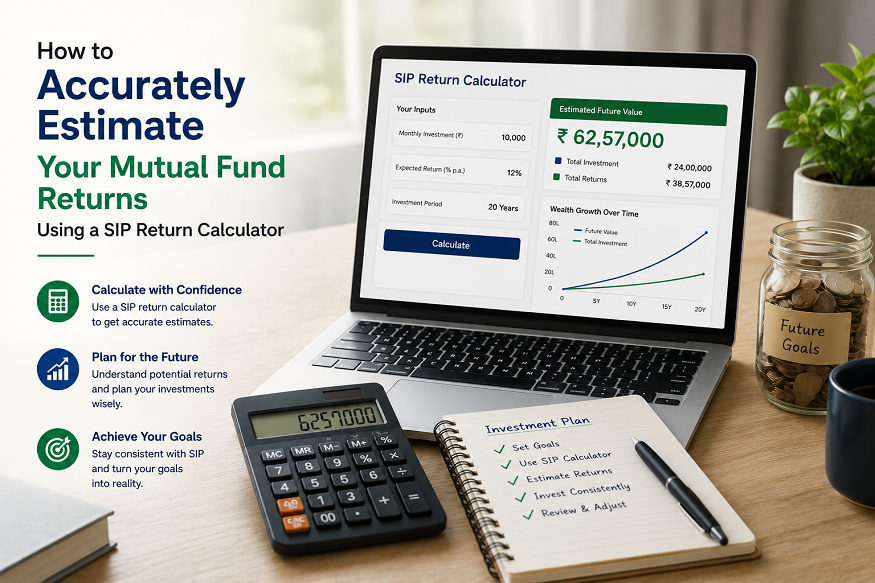
Now, here’s the thing. Using a SIP Return Calculator early in your investment journey isn’t just helpful. It’s kind of essential. It takes your monthly contribution, your expected rate of return, and your investment horizon and spits out a future value that you can work with. It’s not magic. It’s math. But it feels like a superpower the first time you use it.
Why Most People Underestimate Returns (and Overestimate Them Too)
Wait, both? Yes, both. People either expect far too much, like 30% annualized returns, because someone on the internet said equity always gives that, or they dramatically underestimate the compounding effect over long horizons and think their small monthly amount won’t add up to much. The truth, as usual, lives somewhere in the middle, and it depends heavily on how carefully you feed data into your estimation tool.
Read More: Designing Components for Extreme Conditions
Hold on, let me think about that for a moment. The issue isn’t really the calculator itself. It’s the assumptions we put in. Garbage in, garbage out, as they say. If you plug in a wildly optimistic 18% annual return for a debt fund, the number that comes out will look fantastic and be completely divorced from reality. And if you use a conservative 6% for an equity fund with a 20-year horizon, you’ll probably undersell what compounding can actually do for you over that stretch.
The Return Rate Question Is Bigger Than You Think
This is where most people trip. They open a calculator, type in their SIP amount, pick a random return percentage, set a time period, and hit calculate. Done. They screenshot it and feel sorted.
But the return rate you choose is doing an enormous amount of heavy lifting in that equation. Equity funds, over long periods, have historically delivered somewhere in the range of 10 to 14 percent annualized returns, depending on the category and the market cycle. Debt instruments? More like 6 to 8 percent. Hybrid funds? Somewhere in between, naturally.
The smart move is to run three scenarios. An optimistic one, a realistic one, and a conservative one. Call them your best case, your middle ground, and your what-if-things-go-sideways estimate. This gives you a range instead of a single number, and ranges are far more honest about how markets actually behave.
Time plays a more significant role in your investment returns than you may realize.
You know what nobody tells you clearly enough? That in a long SIP, your returns in the final few years are doing a disproportionate amount of the total wealth creation. The first few years, honestly, it’s mostly your own contributions building up. The compounding engine is just warming up. But somewhere around year 12 or 13, things start to accelerate in a way that feels almost unfair in the best possible sense.
So, when you sit down with your estimation tool, don’t just look at the final number. Look at what the corpus looks like at 5, 10, and 15. Most good calculators let you toggle the time horizon easily. Watch what happens to the final value when you extend the period by just three years. You’ll raise an eyebrow. Maybe both.
The Step-Up Factor Nobody Factors In
Here’s where a lot of people leave serious money on the table, conceptually speaking. A flat SIP where you invest the same amount every month for 20 years is decent. But if your income grows even 8 to 10 percent annually, shouldn’t your investment grow too? That’s the idea behind a step-up or top-up option.
When you account for this in your projections, the final corpus jumps up considerably. Most modern tools have a separate input field for this annual increment. If yours doesn’t, you might be working with a more basic version that’ll give you a correct but incomplete picture.
Inflation: The Silent Number Ruiner
Okay, this is where people get a little uncomfortable because the calculator gives you this exciting final number, and then you have to deflate it mentally. A corpus of, say, 1.5 crore in 20 years sounds wonderful right now. Less than it sounds. Probably quite a bit less.
Some sophisticated tools will show you a real value alongside the nominal value. If yours does, pay attention to that real value. That’s the number that tells you what your future corpus is worth in today’s purchasing power terms. If your tool doesn’t show this, divide the nominal figure by the projected inflation factor manually. It’s a little sobering, but it’s the honest picture.
Expense Ratios Are Quietly Eating Your Returns
This one’s subtle but real. Every mutual fund charges an expense ratio, a small annual fee for managing your money. It seems tiny, 0.5% or maybe 1.5% for actively managed funds, but over a 15 or 20-year period, the cumulative drag on returns is more significant than it looks on paper.
When you’re estimating returns, shave off the expense ratio from your expected gross return. So, if a fund has historically delivered 13% and charges 1.2%, your net return assumption should be closer to 11.8%.
Taxes Are Part of the Real Return Picture.
Here’s something a lot of investors conveniently forget while punching numbers. Capital gains taxes apply when you eventually redeem. Equity funds held longer than a year attract long-term capital gains tax at 10% on gains above a certain threshold. Debt funds have their own treatment. So, your pre-tax and post-tax final values can differ meaningfully.
Now, calculators often don’t automatically account for tax. You need to either factor in taxes separately or use a more advanced tax-adjusted projection tool if one is available. The point is, don’t treat the calculator’s output as your take-home number. It’s your gross accumulation number. Your actual take-home after tax will be a bit lower.
How to Actually Use the Estimator Properly
Alright, let’s put this together in a way that’s practical rather than theoretical. First, know your goal. What are you saving for? Write down the target amount and the time you have. Second, work backwards. If you need, say, 50 lakhs in 15 years, put that target in and ask the tool what monthly investment gets you there at a realistic return assumption. Third, run multiple return scenarios as mentioned earlier. Don’t anchor to one number. Fourth, factor in step-ups if your income is expected to grow. Fifth, subtract the expense ratio before entering the return figure. And sixth, remember the tax cut on the backend.
That’s it. It’s not overly complicated, but each of those steps makes your estimate more grounded than just picking a round number and hoping.
The Psychological Benefit Nobody Talks About
Here’s an unexpected observation. Using a projection tool regularly does something to your investing behaviour. When you can see the projected growth curve, you become less likely to panic and exit during market corrections. You’ve already seen the simulation. You know that a down year or two doesn’t necessarily blow up the 20-year picture. That’s an emotional benefit that’s hard to put a rupee value on but very real.
People who’ve used a mutual fund SIP calculator to map out their goals tend to stay invested longer. And staying invested longer is, more often than not, the actual key to the whole thing. Not stock-picking. Not market timing. Just staying put and letting time do its thing.
One Last Thing Before You Go
Look, no projection is a guarantee. Markets are unpredictable, life changes, goals shift, and the economy occasionally throws something nobody saw coming. An estimation tool is exactly that, an estimation. A very useful one, but still not a crystal ball.
Read More : Hard Money: Lending on Different Standards, Not No Standards
What it is, though, is a framework. A way to make smarter decisions with your money rather than winging it. And honestly, in personal finance, a good framework beats a lucky guess every single time. Using a mutual fund SIP Calculator with the right assumptions, honest inputs, and a realistic understanding of taxes and inflation doesn’t just give you a number; it provides a structured approach to your investments. It gives you clarity. And clarity, in the world of long-term investing, might just be the most underrated edge you can have.
Start with realistic numbers. Run the scenarios. Revisit every year. Adjust as life happens. That’s the whole playbook, really.